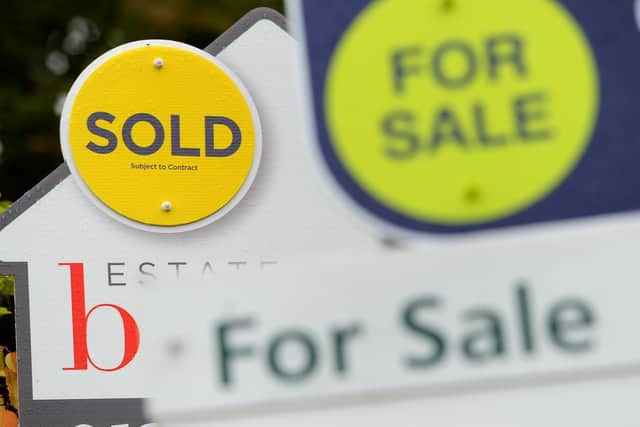
Crawley house prices dropped in January - here's how the town compares to other areas in the South East
and live on Freeview channel 276
But the drop does not reverse the longer-term trend, which has seen property prices in the area achieve 0.3% annual growth.
The average Crawley house price in January was £283,009, Land Registry figures show – a 2.3% decrease on December.
Advertisement
Hide AdAdvertisement
Hide AdOver the month, the picture was worse than that across the South East, where prices increased 0.1%, and Crawley underperformed compared to the 0.5% drop for the UK as a whole.

Over the last year, the average sale price of property in Crawley rose by £890 – putting the area 69th among the South East’s 70 local authorities for annual growth.
The best annual growth in the region was in the Isle of Wight, where property prices increased on average by 14.7%, to £256,000. At the other end of the scale, properties in Horsham lost 0.8% of their value, giving an average price of £375,000.
Winners and Losers
Owners of flats fared worst in Crawley in January – they dropped 3.1% in price, to £182,946 on average. Over the last year, prices dropped by 2.7%.
Among other types of property:
Advertisement
Hide AdAdvertisement
Hide AdDetached: down 1.9% monthly; up 2.3% annually; £569,314 average
Semi-detached: down 1.7% monthly; up 1.4% annually; £364,067 average
Terraced: down 2.1% monthly; up 1.3% annually; £282,200 average
First steps on the property ladder
First-time buyers in Crawley spent an average of £254,970 on their property – £380 less than a year ago, and £23,800 more than in December 2015.
Advertisement
Hide AdAdvertisement
Hide AdBy comparison, former owner-occupiers paid £320,670 on average in January – 25.8% more than first-time buyers.
How do property prices in Crawley compare?
Buyers paid 17.4% less than the average price in the South East (£342,000) in January for a property in Crawley. Across the South East, property prices are higher than those across the UK, where the average cost £249,000.
The most expensive properties in the South East were in Elmbridge – £644,000 on average, and 2.3 times as much as in Crawley. Elmbridge properties cost three times as much as homes in Southampton (£213,000 average), at the other end of the scale.
The highest property prices across the UK were in Kensington and Chelsea, where the average January sale price of £1.3 million could buy 14 properties in Blaenau Gwent (average £93,000).
Factfile
Average property price in January
Crawley: £283,009
The South East: £342,420
UK: £249,309
Annual growth to January
Crawley: +0.3%
The South East: +6.4%
UK: +7.5%
Best and worst annual growth in the South East
The Isle of Wight: +14.7%
Horsham: -0.8%
Comment Guidelines
National World encourages reader discussion on our stories. User feedback, insights and back-and-forth exchanges add a rich layer of context to reporting. Please review our Community Guidelines before commenting.